Cart is empty.
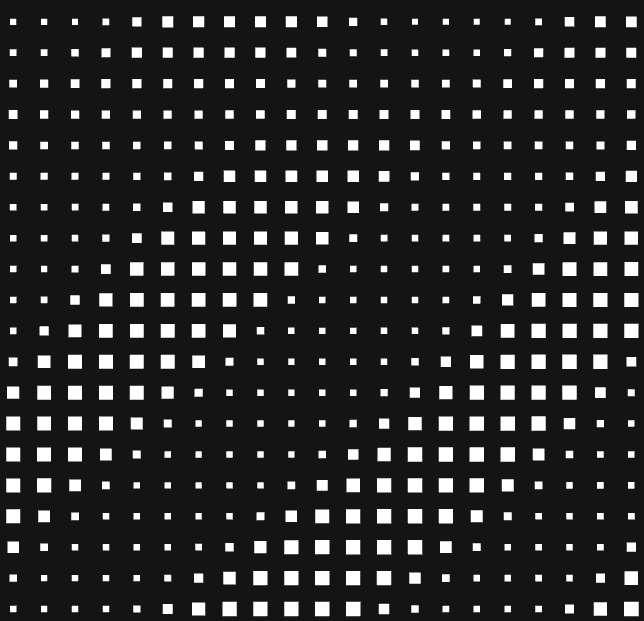
Audio spectrum map
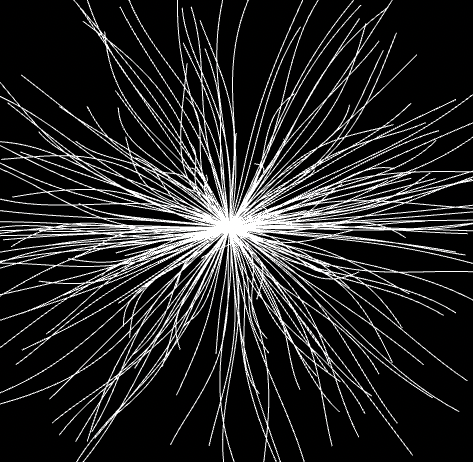
A visual representation of the spectrum of frequencies of a signal as it varies with time.
The bandpass filters uses analog processing to divide the input signal into frequency bands, the magnitude of each filter’s output controls a height that records the spectrogram as points in time connected with line.
OPS used – audiospectrum / analyse / trail / match / geo / render
more on instagram / kosaa